- By Service (Ride-Hailing, Car Sharing, Micro-Mobility, Bus Sharing, Train Services)
- By Solution (Platform-Based Solutions, Payment and Billing Solutions, Navigation Solutions, Ticketing Solutions, Safety and Security Solutions, Others)
- By Business Model (Business-to-Business, Business-to-Consumer, Peer-to-Peer)
- By Transportation (Private, Public)
- By Operating System (Android, iOS, Web-Based)
- By Payment Type (Subscription-Based, Pay-Per-Use)
- By Vehicle Type (Buses, Four-Wheelers, Micro-Mobility, Trains)
MOBILITY AS A SERVICE MARKET REPORT CUSTOMIZATIONRequest Sample PDF to View Undisclosed Values
| Additional Qualitative Customization |
|
|---|---|
| Additional Scope Customization |
|
| Additional Country Level Analysis |
|
REPORT OVERVIEW
The mobility as a service (MaaS) market report offers an in-depth analysis of current trends, future growth opportunities, and the competitive landscape of the industry. It includes detailed market forecasts, insights into supply chain dynamics, and advancements in technology such as integrated platforms and AI-driven route optimization. The report highlights significant industry developments, strategic approaches for market penetration, opportunities for mergers and acquisitions, and regional growth drivers fueled by rising urbanization and the demand for seamless, multimodal transportation solutions. It provides actionable insights for stakeholders to capitalize on emerging opportunities and thrive in this rapidly evolving market.
Mobility as a Service (MaaS) combines various transportation options such as public transport, ridesharing, car-sharing, bike-sharing, scooter-sharing, taxis, car rentals, ride-hailing, etc. into a unified digital mobility package. This personalized service recommends optimal solutions tailored to individual travel requirements, leveraging active mobility and a reliable public transit network. MaaS operates around the clock, providing integrated trip planning, booking, and payment services, along with real-time updates during travel, facilitating convenient mobility and supporting car-free lifestyles.
The core components of MaaS include a digital platform that aggregates transportation services, offering users a convenient way to navigate urban environments. By combining various modes of transit, MaaS enhances accessibility and reduces dependency on private cars, leading to potential benefits like reduced congestion and environmental impact. MaaS platforms also promote shared mobility, optimizing the use of existing transportation infrastructure and resources. This integration of services not only simplifies travel but also provides users with more options to choose from based on factors such as cost, time, and convenience. The rapid progress in mobility as a service technology, coupled with investments from automotive manufacturers is expected to boost global mobility as a service market growth in the forecast period.
GLOBAL MOBILITY AS A SERVICE MARKET TREND
Autonomous Vehicles and Integration of Artificial Intelligence (AI) are Prominent Trends in the Global Mobility as a Service Market
Autonomous technologies and AI are gaining popularity in the global mobility as a service market. Major OEMs and mobility service providers are increasingly allocating resources to the advancement of autonomous vehicle technology. Autonomous vehicles, equipped with sophisticated sensors and AI algorithms, offer the promise of safer, more efficient, and convenient mobility solutions. These vehicles can perceive their environment, navigate roads, and make decisions autonomously, drastically reducing the need for human intervention. As a result, they hold the potential to reshape urban mobility by optimizing traffic flow, reducing accidents, and lowering emissions.
For instance, in April 2023, Moovit, a leading Mobility-as-a-Service (MaaS) provider, collaborated with May Mobility to advance the adoption of shared autonomous vehicles (AVs) within public transportation systems. Under this partnership, May Mobility’s fleet of autonomous vehicles will seamlessly integrate into Moovit’s urban mobility application and on-demand routing software. This integration enables passengers to efficiently plan trips, manage payments, and travel using shared AVs directly through Moovit’s platform.
Moreover, AI and ML play pivotal roles in enhancing MaaS platforms by enabling data-driven decision-making, predictive analytics, and personalized services. One key aspect is its ability to optimize route planning and allocation of resources. AI algorithms analyze vast amounts of data including traffic patterns, user preferences, and real-time conditions to recommend the most efficient routes and modes of transport. This optimization not only reduces commute times and congestion but also enhances the overall user experience. Additionally, AI-powered chatbots and virtual assistants integrated into MaaS platforms offer real-time customer support, improving accessibility and user satisfaction.
DRIVING FACTORS FOR GLOBAL MOBILITY AS A SERVICE MARKET OUTLOOK
Growing Demand for On-Demand Transport Services Will Catalyze the Global Mobility as a Service Market Growth
This shift in consumer behavior is fueled by several factors. Firstly, changing preferences among urban populations, especially millennials and Gen Z, are steering away from traditional car ownership towards more flexible and convenient mobility solutions. On-demand transport services offered through MaaS platforms provide users with the ability to access different modes of transportation (such as ride-hailing, bike-sharing, and public transit) seamlessly and without the commitment of owning a vehicle. Additionally, ride-hailing has garnered attention due to substantial growth in on-demand transportation services. This service enables passengers to request a taxi through ride-hailing applications such as Grab, Lyft, Uber, and Ola, providing convenient door-to-door transportation options that are easy and comfortable to use.
Uber, Annual Trips, 2019-2023 (Billions)
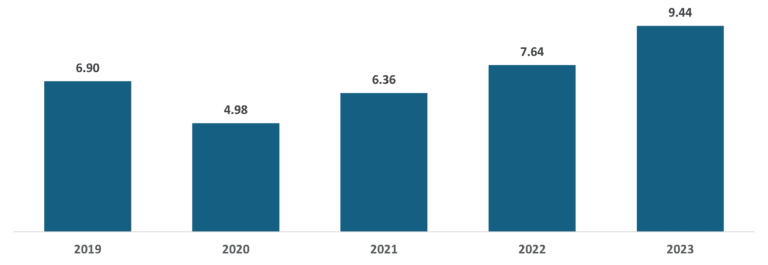
Moreover, the rapid advancement of mobile technology and connectivity is another key driver boosting the market growth. The proliferation of smartphones and mobile apps has made it easier for consumers to access and use on-demand transport services. MaaS platforms leverage this technology to provide users with real-time information about available transportation options, pricing, and routes, enabling them to make informed decisions and plan their journeys efficiently. Furthermore, the growing focus on sustainability and environmental consciousness is propelling the adoption of MaaS solutions. On-demand transport services within MaaS promote shared mobility and encourage the use of eco-friendly transportation options such as electric vehicles and bike-sharing.
RESTRAINING FACTORS FOR GLOBAL MOBILITY AS A SERVICE MARKET ECONOMY
Security Concerns and Infrastructure Limitations May Hamper the Global Mobility as a Service Market Growth
MaaS platforms rely heavily on collecting and processing large volumes of user data, including personal information and travel patterns, to optimize services and provide personalized experiences. However, the increasing reliance on digital technologies and data sharing raises concerns about privacy, data protection, and cybersecurity. Ensuring compliance with data protection regulations, implementing robust encryption methods, and adopting transparent data handling practices are essential to building and maintaining user trust in MaaS services.
Additionally, infrastructure limitations pose another significant constraint on the growth of MaaS initiatives. Successful deployment and operation of MaaS platforms require robust and interconnected transportation systems, including reliable public transit networks, bike-sharing programs, and efficient integration with various mobility services. However, many regions, especially in developing countries or rural areas, lack adequate transportation infrastructure and connectivity. Insufficient infrastructure can impede the seamless integration of transportation services, resulting in fragmented MaaS offerings and limited accessibility for users.
REGIONAL INSIGHTS
Geographically, the global mobility as a service market is segmented into North America, Europe, Asia Pacific, the Middle East, and the Rest of the World.
North America is a leading region in the development and adoption of MaaS solutions, driven by strong technology infrastructure, a high level of urbanization, and a growing preference for shared mobility. The presence of major MaaS providers like Uber, Lyft, and local initiatives in cities like New York and San Francisco has accelerated market growth. In June 2023, Ford Next partnered with Uber to introduce a new leasing program tailored for rideshare drivers transitioning to electric vehicles. This pilot initiative called Ford Drive offers convenient access to Ford Mustang Mach-E models and has been launched in San Diego, San Francisco, and Los Angeles. The program features a flexible leasing option that allows rideshare drivers to choose a Mustang Mach-E for periods ranging from one to four months, depending on their location.
Europe is a key region for MaaS innovation, with cities like Helsinki (Finland) and Vienna (Austria) leading the way in integrated mobility services. The strong public transportation networks, supportive regulatory frameworks, and environmental policies drive MaaS adoption. For instance, in July 2023, The GEMINI (Greening European Mobility through cascading innovation Initiatives) project was initiated as a large-scale innovation action funded by the EU, focusing on the development of new shared mobility services. Over its 42-month duration, GEMINI aims to create and evaluate sustainable business models for New Mobility Services (NMS), which encompass shared connected automated vehicles and shared mobility options in public transport through public-private partnerships. The project’s goal is to enhance the adoption of shared mobility solutions (MaaS and MaaC) among enterprises, families, and tourists.
Asia Pacific is experiencing rapid growth in MaaS adoption, fueled by urbanization, congestion issues, and increasing smartphone penetration. Countries like Japan, South Korea, and China are investing in smart city initiatives and promoting shared mobility. Local players like Didi Chuxing (China), Grab (Southeast Asia), and Ola (India) dominate the regional market, offering diverse mobility solutions. In February 2024, Nissan Motor unveiled its strategy to bring its internally developed autonomous-drive mobility services (equivalent to SAE Level 4) to the commercial market in Japan. Beginning in fiscal year 2027 (April 1 to March 31), collaborating with external partners such as local authorities and transportation operators. Nissan will commence trials in the Minato Mirai area during fiscal year 2024, with plans to expand the trials in the subsequent fiscal year.
In the Middle East, countries like the United Arab Emirates and Saudi Arabia are investing in mobility as a service as part of their smart city initiatives. Other regions such as Latin America, and Africa are also exploring mobility as a service. Challenges include infrastructure gaps, safety concerns, and regulatory barriers in some countries.
KEY INDUSTRY PLAYERS
Key Players are Focusing on the Integration of Autonomous Technology, Geographic Expansion, Partnerships, and Acquisitions to increase the Global Market Share
The global mobility as a service market comprises of key players, such as MaaS Global Oy, Uber Technologies Inc., Beijing Didi Chuxing Technology Co., Ltd., Lyft Inc., Citymapper Limited, and others. These players are focusing on geographic expansion, integration of autonomous technology, investment in R&D, partnerships, and acquisitions to increase their market share in the global market. For instance, in January 2023, Mastercard collaborated with Ubirider to introduce a mobility-as-a-service (MaaS) platform named Pick, aimed at benefiting riders, transport operators, and cities. Together, they will provide advanced digital solutions merging operational, payment, and ticketing resources and data for public transport agencies and operators. Through this partnership, Mastercard can introduce the platform in additional cities without needing to install or replace the current ticketing validators.
LIST OF KEY MARKET PLAYERS
- MaaS Global Oy (Finland)
- Uber Technologies Inc. (U.S.)
- Beijing Didi Chuxing Technology Co., Ltd. (China)
- Lyft Inc. (U.S.)
- Citymapper Limited (U.K.)
- Moovel Group GmbH (Germany)
- Beeline Mobility (U.S.)
- Ubigo Innovation AB (Sweden)
- Moovit Inc. (Israel)
- FOD Mobility Group (U.K.)
KEY INDUSTRY DEVELOPMENTS:
In May 2023, Kia Corporation and Kakao Mobility, a prominent mobility as a service (MaaS) platform company in South Korea, joined forces to create purpose-built vehicles (PBVs) tailored for ride-hailing and other innovative mobility services associated with PBVs. As part of the collaboration, Kia will design customized PBVs based on vehicle operation data to precisely meet the unique needs of Kakao Mobility’s ride-hailing services.
In May 2023, WorldAutoSteel announced intentions to introduce Steel E-Motive, its latest vehicle concept tailored for Mobility as a Service (MaaS). These innovative autonomous concepts pledge significant emissions reductions of up to 86%. Steel E-Motive is geared towards making autonomous ridesharing and ride-hailing vehicles more accessible and environmentally sustainable, leveraging Advanced High-Strength Steel (AHSS) products and technologies.
MOBILITY AS A SERVICE MARKET REPORT SCOPE & SEGMENTATION
| Study Period | 2019-2032 |
|---|---|
| Base Year | 2023 |
| Forecast Period | 2024-2032 |
| Historical Period | 2019-2022 |
| Unit | Value (USD Billion) |
| Market Segmentation | By Service
|
By Solution
| |
By Business Model
| |
By Transportation
| |
By Operating System
| |
By Payment Type
| |
By Vehicle Type
| |
| By Geography |
|
Frequently Asked Questions
Mobility as a Service (MaaS) combines various transportation options such as public transport, ridesharing, car-sharing, bike-sharing, scooter-sharing, taxis, car rentals, ride-hailing, etc. into a unified digital mobility package.
The growing demand for on-demand transport services is the driving factor in mobility as a service market forecast.
Security concerns and infrastructure limitations may hamper global mobility as a service market growth.
Autonomous vehicles and the integration of artificial intelligence (AI) is a prominent trend in global mobility as a service market.
Some of the top players in the market are MaaS Global Oy, Uber Technologies Inc., Beijing Didi Chuxing Technology Co., Ltd., Lyft Inc., Citymapper Limited, and others.
1. Introduction
1.1. Research Scope
1.2. Market Segmentation
1.3. Research Methodology
1.4. Definitions and Assumptions
2. Executive Summary
3. Market Dynamics
3.1. Market Drivers
3.2. Market Restraints
3.3. Market Opportunities
3.4. Market Trends
4. Key Insights
4.1. Market Penetration Strategies – Merger & Acquisition, Partnership & Collaboration, R&D Investment and Others
4.2. Regulatory Landscape
4.3. Supply Chain Analysis
4.4. Latest Technological Advancements
5. Global Mobility as a Service Market Analysis, Insights and Forecast, 2019-2032
5.1 Key Findings / Definition
5.2. Market Analysis, Insights and Forecast – By Service
5.2.1. Ride-Hailing
5.2.2. Car Sharing
5.2.3. Micro-Mobility
5.2.4. Bus Sharing
5.2.5. Train Services
5.3. Market Analysis, Insights and Forecast – By Solution
5.3.1. Platform-Based Solutions
5.3.2. Payment and Billing Engines
5.3.3. Navigation Solutions
5.3.4. Ticketing Solutions
5.3.5. Safety and Security Solutions
5.3.6. Others
5.4. Market Analysis, Insights and Forecast – By Business Model
5.4.1. Business-to-Business
5.4.2. Business-to-Consumer
5.4.3. Peer-to-Peer
5.5. Market Analysis, Insights and Forecast – By Transportation Type
5.5.1. Private
5.5.2. Public
5.6. Market Analysis, Insights and Forecast – By Operating System
5.6.1. Android
5.6.2. iOS
5.6.3. Web-Based
5.7. Market Analysis, Insights and Forecast – By Payment Type
5.7.1. Subscription-Based
5.7.2. Pay-Per-Use
5.8. Market Analysis, Insights and Forecast – By Vehicle Type
5.8.1. Buses
5.8.2. Four-Wheelers
5.8.3. Micro-Mobility
5.8.4. Trains
5.9. Market Analysis, Insights and Forecast – By Region
5.9.1. North America
5.9.2. Europe
5.9.3. Asia Pacific
5.9.4. Middle East
5.9.5. Rest of the World
6. North America Mobility as a Service Market Analysis, Insights and Forecast, 2019-2032
6.1. Market Analysis, Insights and Forecast – By Service
6.1.1. Ride-Hailing
6.1.2. Car Sharing
6.1.3. Micro-Mobility
6.1.4. Bus Sharing
6.1.5. Train Services
6.2. Market Analysis, Insights and Forecast – By Solution
6.2.1. Platform-Based Solutions
6.2.2. Payment and Billing Engines
6.2.3. Navigation Solutions
6.2.4. Ticketing Solutions
6.2.5. Safety and Security Solutions
6.2.6. Others
6.3. Market Analysis, Insights and Forecast – By Business Model
6.3.1. Business-to-Business
6.3.2. Business-to-Consumer
6.3.3. Peer-to-Peer
6.4. Market Analysis, Insights and Forecast – By Transportation Type
6.4.1. Private
6.4.2. Public
6.5. Market Analysis, Insights and Forecast – By Operating System
6.5.1. Android
6.5.2. iOS
6.5.3. Web-Based
6.6. Market Analysis, Insights and Forecast – By Payment Type
6.6.1. Subscription-Based
6.6.2. Pay-Per-Use
6.7. Market Analysis, Insights and Forecast – By Vehicle Type
6.7.1. Buses
6.7.2. Four-Wheelers
6.7.3. Micro-Mobility
6.7.4. Trains
6.8. Market Analysis, Insights and Forecast – By Country
6.8.1. U.S.
6.8.1.1. Market Analysis, Insights and Forecast – By Vehicle Type
6.8.1.1.1. Buses
6.8.1.1.2. Four-Wheelers
6.8.1.1.3. Micro-Mobility
6.8.1.1.4. Trains
6.8.2. Canada
6.8.2.1. Market Analysis, Insights and Forecast – By Vehicle Type
6.8.2.1.1. Buses
6.8.2.1.2. Four-Wheelers
6.8.2.1.3. Micro-Mobility
6.8.2.1.4. Trains
7. Europe Mobility as a Service Market Analysis, Insights and Forecast, 2019-2032
7.1. Market Analysis, Insights and Forecast – By Service
7.1.1. Ride-Hailing
7.1.2. Car Sharing
7.1.3. Micro-Mobility
7.1.4. Bus Sharing
7.1.5. Train Services
7.2. Market Analysis, Insights and Forecast – By Solution
7.2.1. Platform-Based Solutions
7.2.2. Payment and Billing Engines
7.2.3. Navigation Solutions
7.2.4. Ticketing Solutions
7.2.5. Safety and Security Solutions
7.2.6. Others
7.3. Market Analysis, Insights and Forecast – By Business Model
7.3.1. Business-to-Business
7.3.2. Business-to-Consumer
7.3.3. Peer-to-Peer
7.4. Market Analysis, Insights and Forecast – By Transportation Type
7.4.1. Private
7.4.2. Public
7.5. Market Analysis, Insights and Forecast – By Operating System
7.5.1. Android
7.5.2. iOS
7.5.3. Web-Based
7.6. Market Analysis, Insights and Forecast – By Payment Type
7.6.1. Subscription-Based
7.6.2. Pay-Per-Use
7.7. Market Analysis, Insights and Forecast – By Vehicle Type
7.7.1. Buses
7.7.2. Four-Wheelers
7.7.3. Micro-Mobility
7.7.4. Trains
7.8. Market Analysis, Insights and Forecast – By Country
7.8.1. U.K.
7.8.1.1. Market Analysis, Insights and Forecast – By Vehicle Type
7.8.1.1.1. Buses
7.8.1.1.2. Four-Wheelers
7.8.1.1.3. Micro-Mobility
7.8.1.1.4. Trains
7.8.2. Germany
7.8.2.1. Market Analysis, Insights and Forecast – By Vehicle Type
7.8.2.1.1. Buses
7.8.2.1.2. Four-Wheelers
7.8.2.1.3. Micro-Mobility
7.8.2.1.4. Trains
7.8.3. France
7.8.3.1. Market Analysis, Insights and Forecast – By Vehicle Type
7.8.3.1.1. Buses
7.8.3.1.2. Four-Wheelers
7.8.3.1.3. Micro-Mobility
7.8.3.1.4. Trains
7.8.4. Italy
7.8.4.1. Market Analysis, Insights and Forecast – By Vehicle Type
7.8.4.1.1. Buses
7.8.4.1.2. Four-Wheelers
7.8.4.1.3. Micro-Mobility
7.8.4.1.4. Trains
7.8.5. Russia
7.8.5.1. Market Analysis, Insights and Forecast – By Vehicle Type
7.8.5.1.1. Buses
7.8.5.1.2. Four-Wheelers
7.8.5.1.3. Micro-Mobility
7.8.5.1.4. Trains
7.8.6. Finland
7.8.6.1. Market Analysis, Insights and Forecast – By Vehicle Type
7.8.6.1.1. Buses
7.8.6.1.2. Four-Wheelers
7.8.6.1.3. Micro-Mobility
7.8.6.1.4. Trains
7.8.7. Rest of Europe
7.8.7.1. Market Analysis, Insights and Forecast – By Vehicle Type
7.8.7.1.1. Buses
7.8.7.1.2. Four-Wheelers
7.8.7.1.3. Micro-Mobility
7.8.7.1.4. Trains
8. Asia Pacific Mobility as a Service Market Analysis, Insights and Forecast, 2019-2032
8.1. Market Analysis, Insights and Forecast – By Service
8.1.1. Ride-Hailing
8.1.2. Car Sharing
8.1.3. Micro-Mobility
8.1.4. Bus Sharing
8.1.5. Train Services
8.2. Market Analysis, Insights and Forecast – By Solution
8.2.1. Platform-Based Solutions
8.2.2. Payment and Billing Engines
8.2.3. Navigation Solutions
8.2.4. Ticketing Solutions
8.2.5. Safety and Security Solutions
8.2.6. Others
8.3. Market Analysis, Insights and Forecast – By Business Model
8.3.1. Business-to-Business
8.3.2. Business-to-Consumer
8.3.3. Peer-to-Peer
8.4. Market Analysis, Insights and Forecast – By Transportation Type
8.4.1. Private
8.4.2. Public
8.5. Market Analysis, Insights and Forecast – By Operating System
8.5.1. Android
8.5.2. iOS
8.5.3. Web-Based
8.6. Market Analysis, Insights and Forecast – By Payment Type
8.6.1. Subscription-Based
8.6.2. Pay-Per-Use
8.7. Market Analysis, Insights and Forecast – By Vehicle Type
8.7.1. Buses
8.7.2. Four-Wheelers
8.7.3. Micro-Mobility
8.7.4. Trains
8.8. Market Analysis, Insights and Forecast – By Country
8.8.1. China
8.8.1.1. Market Analysis, Insights and Forecast – By Vehicle Type
8.8.1.1.1. Buses
8.8.1.1.2. Four-Wheelers
8.8.1.1.3. Micro-Mobility
8.8.1.1.4. Trains
8.8.2. India
8.8.2.1. Market Analysis, Insights and Forecast – By Vehicle Type
8.8.2.1.1. Buses
8.8.2.1.2. Four-Wheelers
8.8.2.1.3. Micro-Mobility
8.8.2.1.4. Trains
8.8.3. Japan
8.8.3.1. Market Analysis, Insights and Forecast – By Vehicle Type
8.8.3.1.1. Buses
8.8.3.1.2. Four-Wheelers
8.8.3.1.3. Micro-Mobility
8.8.3.1.4. Trains
8.8.4. Australia
8.8.4.1. Market Analysis, Insights and Forecast – By Vehicle Type
8.8.4.1.1. Buses
8.8.4.1.2. Four-Wheelers
8.8.4.1.3. Micro-Mobility
8.8.4.1.4. Trains
8.8.5. South Korea
8.8.5.1. Market Analysis, Insights and Forecast – By Vehicle Type
8.8.5.1.1. Buses
8.8.5.1.2. Four-Wheelers
8.8.5.1.3. Micro-Mobility
8.8.5.1.4. Trains
8.8.6. Rest of Asia Pacific
8.8.6.1. Market Analysis, Insights and Forecast – By Vehicle Type
8.8.6.1.1. Buses
8.8.6.1.2. Four-Wheelers
8.8.6.1.3. Micro-Mobility
8.8.6.1.4. Trains
9. Middle East Mobility as a Service Market Analysis, Insights and Forecast, 2019-2032
9.1. Market Analysis, Insights and Forecast – By Service
9.1.1. Ride-Hailing
9.1.2. Car Sharing
9.1.3. Micro-Mobility
9.1.4. Bus Sharing
9.1.5. Train Services
9.2. Market Analysis, Insights and Forecast – By Solution
9.2.1. Platform-Based Solutions
9.2.2. Payment and Billing Engines
9.2.3. Navigation Solutions
9.2.4. Ticketing Solutions
9.2.5. Safety and Security Solutions
9.2.6. Others
9.3. Market Analysis, Insights and Forecast – By Business Model
9.3.1. Business-to-Business
9.3.2. Business-to-Consumer
9.3.3. Peer-to-Peer
9.4. Market Analysis, Insights and Forecast – By Transportation Type
9.4.1. Private
9.4.2. Public
9.5. Market Analysis, Insights and Forecast – By Operating System
9.5.1. Android
9.5.2. iOS
9.5.3. Web-Based
9.6. Market Analysis, Insights and Forecast – By Payment Type
9.6.1. Subscription-Based
9.6.2. Pay-Per-Use
9.7. Market Analysis, Insights and Forecast – By Vehicle Type
9.7.1. Buses
9.7.2. Four-Wheelers
9.7.3. Micro-Mobility
9.7.4. Trains
9.8. Market Analysis, Insights and Forecast – By Country
9.8.1. UAE
9.8.1.1. Market Analysis, Insights and Forecast – By Vehicle Type
9.8.1.1.1. Buses
9.8.1.1.2. Four-Wheelers
9.8.1.1.3. Micro-Mobility
9.8.1.1.4. Trains
9.8.2. Saudi Arabia
9.8.2.1. Market Analysis, Insights and Forecast – By Vehicle Type
9.8.2.1.1. Buses
9.8.2.1.2. Four-Wheelers
9.8.2.1.3. Micro-Mobility
9.8.2.1.4. Trains
9.8.3. Rest of Middle East
9.8.3.1. Market Analysis, Insights and Forecast – By Vehicle Type
9.8.3.1.1. Buses
9.8.3.1.2. Four-Wheelers
9.8.3.1.3. Micro-Mobility
9.8.3.1.4. Trains
10. Rest of the World Mobility as a Service Market Analysis, Insights and Forecast, 2019-2032
10.1. Market Analysis, Insights and Forecast – By Service
10.1.1. Ride-Hailing
10.1.2. Car Sharing
10.1.3. Micro-Mobility
10.1.4. Bus Sharing
10.1.5. Train Services
10.2. Market Analysis, Insights and Forecast – By Solution
10.2.1. Platform-Based Solutions
10.2.2. Payment and Billing Engines
10.2.3. Navigation Solutions
10.2.4. Ticketing Solutions
10.2.5. Safety and Security Solutions
10.2.6. Others
10.3. Market Analysis, Insights and Forecast – By Business Model
10.3.1. Business-to-Business
10.3.2. Business-to-Consumer
10.3.3. Peer-to-Peer
10.4. Market Analysis, Insights and Forecast – By Transportation Type
10.4.1. Private
10.4.2. Public
10.5. Market Analysis, Insights and Forecast – By Operating System
10.5.1. Android
10.5.2. iOS
10.5.3. Web-Based
10.6. Market Analysis, Insights and Forecast – By Payment Type
10.6.1. Subscription-Based
10.6.2. Pay-Per-Use
10.7. Market Analysis, Insights and Forecast – By Vehicle Type
10.7.1. Buses
10.7.2. Four-Wheelers
10.7.3. Micro-Mobility
10.7.4. Trains
10.8. Market Analysis, Insights and Forecast – By Sub-Region
10.8.1. Latin America
10.8.1.1. Market Analysis, Insights and Forecast – By Vehicle Type
10.8.1.1.1. Buses
10.8.1.1.2. Four-Wheelers
10.8.1.1.3. Micro-Mobility
10.8.1.1.4. Trains
10.8.2. Africa
10.8.2.1. Market Analysis, Insights and Forecast – By Vehicle Type
10.8.2.1.1. Buses
10.8.2.1.2. Four-Wheelers
10.8.2.1.3. Micro-Mobility
10.8.2.1.4. Trains
11. Competitive Analysis
11.1. Global Market Rank Analysis (2023)
11.2. Competitive Dashboard
12. Company Profiles (Overview, Products & Services, Financials (Based on Availability), Recent Developments, Strategies, SWOT Analysis)
12.1. MaaS Global Oy (Finland)
12.2. Uber Technologies Inc. (U.S.)
12.3. Beijing Didi Chuxing Technology Co., Ltd. (China)
12.4. Lyft Inc. (U.S.)
12.5. Citymapper Limited (U.K.)
12.6. Moovel Group GmbH (Germany)
12.7. Beeline Mobility (U.S.)
12.8. Ubigo Innovation AB (Sweden)
12.9. Moovit Inc. (Israel)
12.10. FOD Mobility Group (U.K.)
Table 1: Global Mobility as a Service Market, (USD Billion) Forecast, By Service, 2019-2032
Table 2: Global Mobility as a Service Market, (USD Billion) Forecast, By Solution, 2019-2032
Table 3: Global Mobility as a Service Market, (USD Billion) Forecast, By Business Model, 2019-2032
Table 4: Global Mobility as a Service Market, (USD Billion) Forecast, By Transportation Type, 2019-2032
Table 5: Global Mobility as a Service Market, (USD Billion) Forecast, By Operating System, 2019-2032
Table 6: Global Mobility as a Service Market, (USD Billion) Forecast, By Payment Type, 2019-2032
Table 7: Global Mobility as a Service Market, (USD Billion) Forecast, By Vehicle Type, 2019-2032
Table 8: Global Mobility as a Service Market (USD Billion) Forecast, By Region, 2019-2032
Table 9: North America Mobility as a Service Market, (USD Billion) Forecast, By Service, 2019-2032
Table 10: North America Mobility as a Service Market, (USD Billion) Forecast, By Solution, 2019-2032
Table 11: North America Mobility as a Service Market, (USD Billion) Forecast, By Business Model, 2019-2032
Table 12: North America Mobility as a Service Market, (USD Billion) Forecast, By Transportation Type, 2019-2032
Table 13: North America Mobility as a Service Market, (USD Billion) Forecast, By Operating System, 2019-2032
Table 14: North America Mobility as a Service Market, (USD Billion) Forecast, By Payment Type, 2019-2032
Table 15: North America Mobility as a Service Market, (USD Billion) Forecast, By Vehicle Type, 2019-2032
Table 16: North America Mobility as a Service Market (USD Billion) Forecast, By Country, 2019-2032
Table 17: U.S. Mobility as a Service Market, (USD Billion) Forecast, By Vehicle Type, 2019-2032
Table 18: Canada Mobility as a Service Market, (USD Billion) Forecast, By Vehicle Type, 2019-2032
Table 19: Europe Mobility as a Service Market, (USD Billion) Forecast, By Service, 2019-2032
Table 20: Europe Mobility as a Service Market, (USD Billion) Forecast, By Solution, 2019-2032
Table 21: Europe Mobility as a Service Market, (USD Billion) Forecast, By Business Model, 2019-2032
Table 22: Europe Mobility as a Service Market, (USD Billion) Forecast, By Transportation Type, 2019-2032
Table 23: Europe Mobility as a Service Market, (USD Billion) Forecast, By Operating System, 2019-2032
Table 24: Europe Mobility as a Service Market, (USD Billion) Forecast, By Payment Type, 2019-2032
Table 25: Europe Mobility as a Service Market, (USD Billion) Forecast, By Vehicle Type, 2019-2032
Table 26: Europe Mobility as a Service Market (USD Billion) Forecast, By Country, 2019-2032
Table 27: U.K. Mobility as a Service Market, (USD Billion) Forecast, By Vehicle Type, 2019-2032
Table 28: Germany Mobility as a Service Market, (USD Billion) Forecast, By Vehicle Type, 2019-2032
Table 29: France Mobility as a Service Market, (USD Billion) Forecast, By Vehicle Type, 2019-2032
Table 30: Italy Mobility as a Service Market, (USD Billion) Forecast, By Vehicle Type, 2019-2032
Table 31: Russia Mobility as a Service Market, (USD Billion) Forecast, By Vehicle Type, 2019-2032
Table 32: Finland Mobility as a Service Market, (USD Billion) Forecast, By Vehicle Type, 2019-2032
Table 33: Rest of Europe Mobility as a Service Market, (USD Billion) Forecast, By Vehicle Type, 2019-2032
Table 34: Asia Pacific Mobility as a Service Market, (USD Billion) Forecast, By Service, 2019-2032
Table 35: Asia Pacific Mobility as a Service Market, (USD Billion) Forecast, By Solution, 2019-2032
Table 36: Asia Pacific Mobility as a Service Market, (USD Billion) Forecast, By Business Model, 2019-2032
Table 37: Asia Pacific Mobility as a Service Market, (USD Billion) Forecast, By Transportation Type, 2019-2032
Table 38: Asia Pacific Mobility as a Service Market, (USD Billion) Forecast, By Operating System, 2019-2032
Table 39: Asia Pacific Mobility as a Service Market, (USD Billion) Forecast, By Payment Type, 2019-2032
Table 40: Asia Pacific Mobility as a Service Market, (USD Billion) Forecast, By Vehicle Type, 2019-2032
Table 41: Asia Pacific Mobility as a Service Market (USD Billion) Forecast, By Country, 2019-2032
Table 42: China Mobility as a Service Market, (USD Billion) Forecast, By Vehicle Type, 2019-2032
Table 43: India Mobility as a Service Market, (USD Billion) Forecast, By Vehicle Type, 2019-2032
Table 44: Japan Mobility as a Service Market, (USD Billion) Forecast, By Vehicle Type, 2019-2032
Table 45: Australia Mobility as a Service Market, (USD Billion) Forecast, By Vehicle Type, 2019-2032
Table 46: South Korea Mobility as a Service Market, (USD Billion) Forecast, By Vehicle Type, 2019-2032
Table 47: Rest of Asia Pacific Mobility as a Service Market, (USD Billion) Forecast, By Vehicle Type, 2019-2032
Table 48: Middle East Mobility as a Service Market, (USD Billion) Forecast, By Service, 2019-2032
Table 49: Middle East Mobility as a Service Market, (USD Billion) Forecast, By Solution, 2019-2032
Table 50: Middle East Mobility as a Service Market, (USD Billion) Forecast, By Business Model, 2019-2032
Table 51: Middle East Mobility as a Service Market, (USD Billion) Forecast, By Transportation Type, 2019-2032
Table 52: Middle East Mobility as a Service Market, (USD Billion) Forecast, By Operating System, 2019-2032
Table 53: Middle East Mobility as a Service Market, (USD Billion) Forecast, By Payment Type, 2019-2032
Table 54: Middle East Mobility as a Service Market, (USD Billion) Forecast, By Vehicle Type, 2019-2032
Table 55: Middle East Mobility as a Service Market (USD Billion) Forecast, By Country, 2019-2032
Table 56: UAE Mobility as a Service Market, (USD Billion) Forecast, By Vehicle Type, 2019-2032
Table 57: Saudi Arabia Mobility as a Service Market, (USD Billion) Forecast, By Vehicle Type, 2019-2032
Table 58: Rest of Middle East Mobility as a Service Market, (USD Billion) Forecast, By Vehicle Type, 2019-2032
Table 59: Rest of the World Mobility as a Service Market, (USD Billion) Forecast, By Service, 2019-2032
Table 60: Rest of the World Mobility as a Service Market, (USD Billion) Forecast, By Solution, 2019-2032
Table 61: Rest of the World Mobility as a Service Market, (USD Billion) Forecast, By Business Model, 2019-2032
Table 62: Rest of the World Mobility as a Service Market, (USD Billion) Forecast, By Transportation Type, 2019-2032
Table 63: Rest of the World Mobility as a Service Market, (USD Billion) Forecast, By Operating System, 2019-2032
Table 64: Rest of the World Mobility as a Service Market, (USD Billion) Forecast, By Payment Type, 2019-2032
Table 65: Rest of the World Mobility as a Service Market, (USD Billion) Forecast, By Vehicle Type, 2019-2032
Table 66: Rest of the World Mobility as a Service Market (USD Billion) Forecast, By Sub-Region, 2019-2032
Table 67: Latin America Mobility as a Service Market, (USD Billion) Forecast, By Vehicle Type, 2019-2032
Table 68: Africa Mobility as a Service Market, (USD Billion) Forecast, By Vehicle Type, 2019-2032
Figure 1: Global Mobility as a Service Market Revenue Breakdown, (USD Billion, %), By Region, 2024 & 2032
Figure 2: Global Mobility as a Service Market (%) Breakdown, By Service, 2023 & 2032
Figure 3: Global Mobility as a Service Market (USD Billion) Breakdown, By Ride-Hailing, 2019-2032
Figure 4: Global Mobility as a Service Market (USD Billion) Breakdown, By Car Sharing, 2019-2032
Figure 5: Global Mobility as a Service Market (USD Billion) Breakdown, By Micro-Mobility, 2019-2032
Figure 6: Global Mobility as a Service Market (USD Billion) Breakdown, By Bus Sharing, 2019-2032
Figure 7: Global Mobility as a Service Market (USD Billion) Breakdown, By Train Services, 2019-2032
Figure 8: Global Mobility as a Service Market (%) Breakdown, By Solution, 2023 & 2032
Figure 9: Global Mobility as a Service Market (USD Billion) Breakdown, By Platform-Based Solutions, 2019-2032
Figure 10: Global Mobility as a Service Market (USD Billion) Breakdown, By Payment and Billing Engines, 2019-2032
Figure 11: Global Mobility as a Service Market (USD Billion) Breakdown, By Navigation Solutions, 2019-2032
Figure 12: Global Mobility as a Service Market (USD Billion) Breakdown, By Ticketing Solutions, 2019-2032
Figure 13: Global Mobility as a Service Market (USD Billion) Breakdown, By Safety and Security Solutions, 2019-2032
Figure 14: Global Mobility as a Service Market (USD Billion) Breakdown, By Others, 2019-2032
Figure 15: Global Mobility as a Service Market (%) Breakdown, By Business Model, 2023 & 2032
Figure 16: Global Mobility as a Service Market (USD Billion) Breakdown, By Business-to-Business, 2019-2032
Figure 17: Global Mobility as a Service Market (USD Billion) Breakdown, By Business-to-Consumer, 2019-2032
Figure 18: Global Mobility as a Service Market (USD Billion) Breakdown, By Peer-to-Peer, 2019-2032
Figure 19: Global Mobility as a Service Market (%) Breakdown, By Transportation Type, 2023 & 2032
Figure 20: Global Mobility as a Service Market (USD Billion) Breakdown, By Private, 2019-2032
Figure 21: Global Mobility as a Service Market (USD Billion) Breakdown, By Public, 2019-2032
Figure 22: Global Mobility as a Service Market (%) Breakdown, By Operating System, 2023 & 2032
Figure 23: Global Mobility as a Service Market (USD Billion) Breakdown, By Android, 2019-2032
Figure 24: Global Mobility as a Service Market (USD Billion) Breakdown, By iOS, 2019-2032
Figure 25: Global Mobility as a Service Market (USD Billion) Breakdown, By Web-Based, 2019-2032
Figure 26: Global Mobility as a Service Market (%) Breakdown, By Payment Type, 2023 & 2032
Figure 27: Global Mobility as a Service Market (USD Billion) Breakdown, By Subscription-Based, 2019-2032
Figure 28: Global Mobility as a Service Market (USD Billion) Breakdown, By Pay-Per-Use, 2019-2032
Figure 29: Global Mobility as a Service Market (%) Breakdown, By Vehicle Type, 2023 & 2032
Figure 30: Global Mobility as a Service Market (USD Billion) Breakdown, By Buses, 2019-2032
Figure 31: Global Mobility as a Service Market (USD Billion) Breakdown, By Four-Wheelers, 2019-2032
Figure 32: Global Mobility as a Service Market (USD Billion) Breakdown, By Micro-Mobility, 2019-2032
Figure 33: Global Mobility as a Service Market (USD Billion) Breakdown, By Trains, 2019-2032
Figure 34: Global Mobility as a Service Market Share (%), By Region, 2023 & 2032
Figure 35: North America Mobility as a Service Market Value (USD Billion), By Service, 2023 & 2032
Figure 36: North America Mobility as a Service Market Value Share (%), By Service, 2023
Figure 37: North America Mobility as a Service Market Value (USD Billion), By Solution, 2023 & 2032
Figure 38: North America Mobility as a Service Market Value Share (%), By Solution, 2023
Figure 39: North America Mobility as a Service Market Value (USD Billion), By Business Model, 2023 & 2032
Figure 40: North America Mobility as a Service Market Value Share (%), By Business Model, 2023
Figure 41: North America Mobility as a Service Market Value (USD Billion), By Transportation Type, 2023 & 2032
Figure 42: North America Mobility as a Service Market Value Share (%), By Transportation Type, 2023
Figure 43: North America Mobility as a Service Market Value (USD Billion), By Operating System, 2023 & 2032
Figure 44: North America Mobility as a Service Market Value Share (%), By Operating System, 2023
Figure 45: North America Mobility as a Service Market Value (USD Billion), By Payment Type, 2023 & 2032
Figure 46: North America Mobility as a Service Market Value Share (%), By Payment Type, 2023
Figure 47: North America Mobility as a Service Market Value (USD Billion), By Vehicle Type, 2023 & 2032
Figure 48: North America Mobility as a Service Market Value Share (%), By Vehicle Type, 2023
Figure 49: North America Mobility as a Service Market Value (USD Billion), By Country, 2023 & 2032
Figure 50: North America Mobility as a Service Value Share (%), By Country, 2023
Figure 51: U.S. Mobility as a Service Market Value (USD Billion), By Vehicle Type, 2023 & 2032
Figure 52: U.S. Mobility as a Service Market Value Share (%), By Vehicle Type, 2023
Figure 53: Canada Mobility as a Service Market Value (USD Billion), By Vehicle Type, 2023 & 2032
Figure 54: Canada Mobility as a Service Market Value Share (%), By Vehicle Type, 2023
Figure 55: Europe Mobility as a Service Market Value (USD Billion), By Service, 2023 & 2032
Figure 56: Europe Mobility as a Service Market Value Share (%), By Service, 2023
Figure 57: Europe Mobility as a Service Market Value (USD Billion), By Solution, 2023 & 2032
Figure 58: Europe Mobility as a Service Market Value Share (%), By Solution, 2023
Figure 59: Europe Mobility as a Service Market Value (USD Billion), By Business Model, 2023 & 2032
Figure 60: Europe Mobility as a Service Market Value Share (%), By Business Model, 2023
Figure 61: Europe Mobility as a Service Market Value (USD Billion), By Transportation Type, 2023 & 2032
Figure 62: Europe Mobility as a Service Market Value Share (%), By Transportation Type, 2023
Figure 63: Europe Mobility as a Service Market Value (USD Billion), By Operating System, 2023 & 2032
Figure 64: Europe Mobility as a Service Market Value Share (%), By Operating System, 2023
Figure 65: Europe Mobility as a Service Market Value (USD Billion), By Payment Type, 2023 & 2032
Figure 66: Europe Mobility as a Service Market Value Share (%), By Payment Type, 2023
Figure 67: Europe Mobility as a Service Market Value (USD Billion), By Vehicle Type, 2023 & 2032
Figure 68: Europe Mobility as a Service Market Value Share (%), By Vehicle Type, 2023
Figure 69: Europe Mobility as a Service Market Value (USD Billion), By Country, 2023 & 2032
Figure 70: Europe Mobility as a Service Value Share (%), By Country, 2023
Figure 71: U.K. Mobility as a Service Market Value (USD Billion), By Vehicle Type, 2023 & 2032
Figure 72: U.K. Mobility as a Service Market Value Share (%), By Vehicle Type, 2023
Figure 73: Germany Mobility as a Service Market Value (USD Billion), By Vehicle Type, 2023 & 2032
Figure 74: Germany Mobility as a Service Market Value Share (%), By Vehicle Type, 2023
Figure 75: France Mobility as a Service Market Value (USD Billion), By Vehicle Type, 2023 & 2032
Figure 76: France Mobility as a Service Market Value Share (%), By Vehicle Type, 2023
Figure 77: Italy Mobility as a Service Market Value (USD Billion), By Vehicle Type, 2023 & 2032
Figure 78: Italy Mobility as a Service Market Value Share (%), By Vehicle Type, 2023
Figure 79: Russia Mobility as a Service Market Value (USD Billion), By Vehicle Type, 2023 & 2032
Figure 80: Russia Mobility as a Service Market Value Share (%), By Vehicle Type, 2023
Figure 81: Finland Mobility as a Service Market Value (USD Billion), By Vehicle Type, 2023 & 2032
Figure 82: Finland Mobility as a Service Market Value Share (%), By Vehicle Type, 2023
Figure 83: Rest of Europe Mobility as a Service Market Value (USD Billion), By Vehicle Type, 2023 & 2032
Figure 84: Rest of Europe Mobility as a Service Market Value Share (%), By Vehicle Type, 2023
Figure 85: Asia Pacific Mobility as a Service Market Value (USD Billion), By Service, 2023 & 2032
Figure 86: Asia Pacific Mobility as a Service Market Value Share (%), By Service, 2023
Figure 87: Asia Pacific Mobility as a Service Market Value (USD Billion), By Solution, 2023 & 2032
Figure 88: Asia Pacific Mobility as a Service Market Value Share (%), By Solution, 2023
Figure 89: Asia Pacific Mobility as a Service Market Value (USD Billion), By Business Model, 2023 & 2032
Figure 90: Asia Pacific Mobility as a Service Market Value Share (%), By Business Model, 2023
Figure 91: Asia Pacific Mobility as a Service Market Value (USD Billion), By Transportation Type, 2023 & 2032
Figure 92: Asia Pacific Mobility as a Service Market Value Share (%), By Transportation Type, 2023
Figure 93: Asia Pacific Mobility as a Service Market Value (USD Billion), By Operating System, 2023 & 2032
Figure 94: Asia Pacific Mobility as a Service Market Value Share (%), By Operating System, 2023
Figure 95: Asia Pacific Mobility as a Service Market Value (USD Billion), By Payment Type, 2023 & 2032
Figure 96: Asia Pacific Mobility as a Service Market Value Share (%), By Payment Type, 2023
Figure 97: Asia Pacific Mobility as a Service Market Value (USD Billion), By Vehicle Type, 2023 & 2032
Figure 98: Asia Pacific Mobility as a Service Market Value Share (%), By Vehicle Type, 2023
Figure 99: Asia Pacific Mobility as a Service Market Value (USD Billion), By Country, 2023 & 2032
Figure 100: Asia Pacific Mobility as a Service Value Share (%), By Country, 2023
Figure 101: China Mobility as a Service Market Value (USD Billion), By Vehicle Type, 2023 & 2032
Figure 102: China Mobility as a Service Market Value Share (%), By Vehicle Type, 2023
Figure 103: India Mobility as a Service Market Value (USD Billion), By Vehicle Type, 2023 & 2032
Figure 104: India Mobility as a Service Market Value Share (%), By Vehicle Type, 2023
Figure 105: Japan Mobility as a Service Market Value (USD Billion), By Vehicle Type, 2023 & 2032
Figure 106: Japan Mobility as a Service Market Value Share (%), By Vehicle Type, 2023
Figure 107: Australia Mobility as a Service Market Value (USD Billion), By Vehicle Type, 2023 & 2032
Figure 108: Australia Mobility as a Service Market Value Share (%), By Vehicle Type, 2023
Figure 109: South Korea Mobility as a Service Market Value (USD Billion), By Vehicle Type, 2023 & 2032
Figure 110: South Korea Mobility as a Service Market Value Share (%), By Vehicle Type, 2023
Figure 111: Rest of Asia Pacific Mobility as a Service Market Value (USD Billion), By Vehicle Type, 2023 & 2032
Figure 112: Rest of Asia Pacific Mobility as a Service Market Value Share (%), By Vehicle Type, 2023
Figure 113: Middle East Mobility as a Service Market Value (USD Billion), By Service, 2023 & 2032
Figure 114: Middle East Mobility as a Service Market Value Share (%), By Service, 2023
Figure 115: Middle East Mobility as a Service Market Value (USD Billion), By Solution, 2023 & 2032
Figure 116: Middle East Mobility as a Service Market Value Share (%), By Solution, 2023
Figure 117: Middle East Mobility as a Service Market Value (USD Billion), By Business Model, 2023 & 2032
Figure 118: Middle East Mobility as a Service Market Value Share (%), By Business Model, 2023
Figure 119: Middle East Mobility as a Service Market Value (USD Billion), By Transportation Type, 2023 & 2032
Figure 120: Middle East Mobility as a Service Market Value Share (%), By Transportation Type, 2023
Figure 121: Middle East Mobility as a Service Market Value (USD Billion), By Operating System, 2023 & 2032
Figure 122: Middle East Mobility as a Service Market Value Share (%), By Operating System, 2023
Figure 123: Middle East Mobility as a Service Market Value (USD Billion), By Payment Type, 2023 & 2032
Figure 124: Middle East Mobility as a Service Market Value Share (%), By Payment Type, 2023
Figure 125: Middle East Mobility as a Service Market Value (USD Billion), By Vehicle Type, 2023 & 2032
Figure 126: Middle East Mobility as a Service Market Value Share (%), By Vehicle Type, 2023
Figure 127: Middle East Mobility as a Service Market Value (USD Billion), By Country, 2023 & 2032
Figure 128: Middle East Mobility as a Service Value Share (%), By Country, 2023
Figure 129: UAE Mobility as a Service Market Value (USD Billion), By Vehicle Type, 2023 & 2032
Figure 130: UAE Mobility as a Service Market Value Share (%), By Vehicle Type, 2023
Figure 131: Saudi Arabia Mobility as a Service Market Value (USD Billion), By Vehicle Type, 2023 & 2032
Figure 132: Saudi Arabia Mobility as a Service Market Value Share (%), By Vehicle Type, 2023
Figure 133: Rest of Middle East Mobility as a Service Market Value (USD Billion), By Vehicle Type, 2023 & 2032
Figure 134: Rest of Middle East Mobility as a Service Market Value Share (%), By Vehicle Type, 2023
Figure 135: Rest of the World Mobility as a Service Market Value (USD Billion), By Service, 2023 & 2032
Figure 136: Rest of the World Mobility as a Service Market Value Share (%), By Service, 2023
Figure 137: Rest of the World Mobility as a Service Market Value (USD Billion), By Solution, 2023 & 2032
Figure 138: Rest of the World Mobility as a Service Market Value Share (%), By Solution, 2023
Figure 139: Rest of the World Mobility as a Service Market Value (USD Billion), By Business Model, 2023 & 2032
Figure 140: Rest of the World Mobility as a Service Market Value Share (%), By Business Model, 2023
Figure 141: Rest of the World Mobility as a Service Market Value (USD Billion), By Transportation Type, 2023 & 2032
Figure 142: Rest of the World Mobility as a Service Market Value Share (%), By Transportation Type, 2023
Figure 143: Rest of the World Mobility as a Service Market Value (USD Billion), By Operating System, 2023 & 2032
Figure 144: Rest of the World Mobility as a Service Market Value Share (%), By Operating System, 2023
Figure 145: Rest of the World Mobility as a Service Market Value (USD Billion), By Payment Type, 2023 & 2032
Figure 146: Rest of the World Mobility as a Service Market Value Share (%), By Payment Type, 2023
Figure 147: Rest of the World Mobility as a Service Market Value (USD Billion), By Vehicle Type, 2023 & 2032
Figure 148: Rest of the World Mobility as a Service Market Value Share (%), By Vehicle Type, 2023
Figure 149: Rest of the World Mobility as a Service Market Value (USD Billion), By Sub-Region, 2023 & 2032
Figure 150: Rest of the World Mobility as a Service Value Share (%), By Sub-Region, 2023
Figure 151: Latin America Mobility as a Service Market Value (USD Billion), By Vehicle Type, 2023 & 2032
Figure 152: Latin America Mobility as a Service Market Value Share (%), By Vehicle Type, 2023
Figure 153: Africa Mobility as a Service Market Value (USD Billion), By Vehicle Type, 2023 & 2032
Figure 154: Africa Mobility as a Service Market Value Share (%), By Vehicle Type, 2023
Figure 155: Global Mobility as a Service Market Rank Analysis, By Key Players, 2023
MOBILITY AS A SERVICE MARKET REPORT SCOPE & SEGMENTATION
| Study Period | 2019-2032 |
|---|---|
| Base Year | 2023 |
| Forecast Period | 2024-2032 |
| Historical Period | 2019-2022 |
| Unit | Value (USD Billion) |
| Market Segmentation | By Service
|
By Solution
| |
By Business Model
| |
By Transportation
| |
By Operating System
| |
By Payment Type
| |
By Vehicle Type
| |
| By Geography |
|