- By Light Displacement Tonnage (LDT) (Below 20,000 Tons, 20,000 To 40,000 Tons, and Above 40,000 Tons)
- By Method (Alongside, Beaching, Dry Dock, and Others)
- By Type of Ship (Tankers, Bulk Carriers, Ferries And Passenger Ships, Container Ship, General Cargo Ships, and Others)
SHIP BREAKING MARKET REPORT CUSTOMIZATION Request Sample PDF for Undisclosed Values
| Additional Qualitative Customization |
|
|---|---|
| Cross Segment Customization |
|
| Additional Country Level Analysis in Customization |
|
REPORT OVERVIEW
The ship breaking market report offers a comprehensive analysis of current trends, future growth opportunities, and the competitive dynamics within the industry. It includes detailed market forecasts, insights into supply chain processes, and advancements in technology, such as automated dismantling systems and eco-friendly recycling methods. The report examines key industry developments, strategic approaches for market entry, merger and acquisition opportunities, and regional growth drivers propelled by the rising demand for sustainable material recovery and increased ship decommissioning activities. It provides actionable insights for stakeholders to leverage emerging opportunities and thrive in this evolving market.
Ship breaking refers to the scrapping or dismantling of a ship when it reaches its end-of-life. Depending on the type of ship and its utilization, ships are usually sent to scrapping yards after 25 to 40 years of lifespan. Ship breaking market is being dominated by leading players across South Asia majorly owing to availability of availability of resources at lower rates. Bangladesh, India, and Pakistan are the top countries where the majority of ship scrapping shipyards are established. The rising age of the fleet and increasing safety concerns are driving the global ship breaking market growth.
Labor safety issues and environmental norms also play crucial role in ship breaking market. Several incidents of labor death owing to lack of safety standards, exposure to hazardous material and so on have led to emergence of several regulation for ship scrapping industry. For instance, Hong Kong International Convention, which was framed by IMO Member States, several non-governmental organizations, International Labour Organization and so on, aimed to improvise the safety standards and working conditions at ship scrapping yards across the globe. Hong Kong International Convention will be implemented from June 2025. Such developments propel the global ship breaking market during the forecast period.
GLOBAL SHIP BREAKING MARKET TREND
Process Automation through Robotics in Ship Recycling is a Prominent Trend for Global Ship Breaking Market
Key developments in machine learning and artificial intelligence have led to increased adoption of industrial robots in different industries such as aviation, space, defense, automotive and so on. Different industrial task such as material handling, measurement, machining, fabrication, measurements and so on are getting performed by industrial robots. In recent years, shipbuilding industry has also witnessed the increased adoption of robotics in shipbuilding.
For instance, in October 2023, Hanwha Ocean, Korean ship building company, has demonstrated nearly 70% of the shipbuilding processes through AI, robotics and other digital technologies. Similarly, in October 2022, Sarcos had successfully tested the Guardian DX and Sapien 6M robots for Ship Repair and Maintenance activities.
Similarly, many ship breaking yards and start-ups are focusing on process automation for ship recycling industry as well. For instance, in November 2022, Circular Maritime Technologies (CMT) received funding from EU for process automation in ship recycling industry. Hence, such developments will improve the ship breaking process efficiency and safety standards at ship breaking yards.
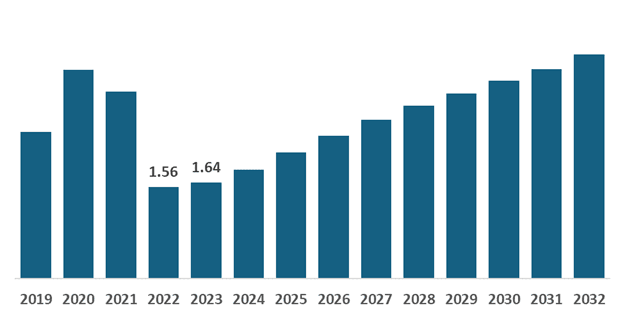
EUROPE SHIP BREAKING MARKET SIZE, 2019-2032 (USD BILLION)
DRIVING FACTORS FOR GLOBAL SHIP BREAKING MARKET OUTLOOK
Aging of Ship Fleet and Implementation of Safety & Environmental Norms are the Key Factors in Ship Breaking Market Forecast
Ships are sent to scrapping yards at the end-of-life depending on its working conditions and safety measures. On an average, after 25 to 40 years, ships are scrapped across the globe. Increasing age of the existing fleet has led to higher demand for ship recycling in recent years. For instance, as per the market analysis, more than 600 million deadweight tons of ships will be scrapped in next 10 years. Increased deliveries in historic years have led to such significant rise in demand for ship breaking market during the forecast period. Moreover, cyclicity in the ship building market also plays crucial role in ship scrapping market growth.
Along with the rising age of the fleet, implementation of stringent environmental norms by International Maritime Organization (IMO) will also lead to increased scrapping of older ships which does not the meet the stated environmental norms. Under its GHG strategy, IMO has planned to reach net zero GHG emission by 2050. IMO has planned to implement Carbon Intensity Indicator (CII) from A to E for all ships. Ships with poor rating will be fined and owners have to take corrective measures. Such regulation will lead to scrapping of older ships and procurement of new ship to match the emission norms which will ultimately drive the ship breaking market.
Ship Breaking in 2022 (in thousand tonnage)

RESTRAINING FACTORS FOR GLOBAL SHIP BREAKING MARKET ECONOMY
Stringent Environmental Norms and Safety Standard may Hamper the Ship Breaking Market Growth
Before the scrapping of any ship, ship owners have to take environmental clearance. The complex process of environmental clearance has led to delay in approvals to initiate the dismantling and scraping process. In March 2023, ship breaking industry has been reclassified and downgraded as ‘red’ from ‘orange-b’. Owing to such regulations, ship breakers from Bangladesh has been waiting for approval of more than 40 ships since last three months. Bank load interest on these ships is causing loss of USD 0.23 million per day. Hence, such regulations and delay in approval hampers the ship breaking market economy across the globe.
Moreover, several incidents of death of workers has highlighted the lack of onsite safety standards at global level. As per the reports, more than 440 workers have lost their life due to lack of protective equipment on site. Such incidents hampers the market growth of ship breaking across the globe.
SEGMENTATION
- By Light Displacement Tonnage (LDT) Analysis
Below 20,000 Tons Segment Dominated the Market owing to Increased Scrapping of Small Sized Ships
By Light Displacement Tonnage (LDT), the market is bifurcated into Below 20,000 Tons, 20,000 to 40,000 Tons, and above 40,000 Tons. Below 20,000 Tons dominated the ship breaking market owing to the increased scrapping of small-sized ships. Small-sized container ships, passenger ships, ferries, and so on usually weigh below 20,000 LDT. Scrapping of such ships across the globe drives the market of this segment.
The above 40,000 Tons segment is estimated to be the fastest growing segment owing to the rising age of the existing fleet and implementation of stringent emissions by IMO. For instance, in April 2023, Carnival Cruise Line sold 6 ships for scrapping to Aliaa ship breaking yard in Turkey. Such developments propel the market growth of above 40,000 Tons segment during the forecast period.
- By Method Analysis
Beaching Segment Dominated the Ship Breaking Market Owing to Cost Effectiveness over Other Methods
By Method, the market is segmented as Alongside, Beaching, Dry Dock and Other. Beaching segment dominated the market owing to preference given such method by majority of ship breaking yards. Alongside segment is estimated to be the fastest growing during the forecast period owing to enhanced effectiveness and safety standards in the method. Adoption of Hong Kong Convention will further promote the use of Alongside methodology for ship breaking.
- By Type of Ship
Tankers Segment Dominated the Ship Breaking Market Owing to High Cost and Increased Scrapping across the Globe
By type of ship, the ship breaking market is bifurcated into Tankers, Bulk Carriers, Ferries and Passenger Ships, Container Ship, General Cargo Ship and Others. Tankers dominated the ship breaking market owing to its larger size and high cost of scrapping. More than 2,700 thousand tons of oil tankers were scrapped in the year 2022 across the globe.
Container segment is estimated to be the fastest growing during the forecast period owing to increased historic deliveries of containers. Also, majority of ship liners are planning to optimize the route which will lead to increased container ship breaking globally.
Global Ship Breaking Market Share, By Type of Ship – 2023

REGIONAL INSIGHTS
By geography, the market is bifurcated into Asia Pacific, Europe, North America, Latin America and Middle East & Africa.
North America ship breaking market holds a significant share and is estimated to grow notably owing to increased scrapping and investment towards building new ship breaking facilities across the region. For instance, in December 2023, Amix Real Estate Holdings has proposed to develop a ship breaking facility at Port Mellon, Canada. Such initiatives will reduce the dependence of western countries on South Asia for ship recycling activities.
Europe holds the highest share in global ship breaking market owing to presence of major ship owners across the region. European ship breaking market is also estimated to be the fastest growing owing aging fleet across the region. Moreover, EU has also approved the many non-OECD recycling yards for the ship breaking of Europe based ships. Such initiatives catalyze the Europe ship breaking market growth.
Asia Pacific ship breaking market is estimated to grow significantly owing presence of major ship breaking yards and support from governments across the region to boost the ship breaking economy. For instance, in July 2023, Gujarat government as allocated USD 3.4 million to Alang ship yard and waived off few taxes to promote the ship breaking industry. Such policy level initiatives from governments across the region is catalyzing the market.
Middle East & Africa and Latin America ship breaking market is estimated to grow notably during the forecast period owing to rising investments in new ship breaking facilities. For instance, in March 2023, Wreckdock, a Saudi Atabia based vessel recycling startup, has announced to raise USD 300 million to setup shipyard which can dismantle nearly 50 ships a year. Such developments propel the ship breaking market.
KEY INDUSTRY PLAYERS
Key Players are Focusing on Capacity Expansion and Technology Adoption to increase the Global Market Share
The global ship breaking market is consolidated in nature with presence of key players, such as · Alang Ship Breaking Yard, PHP, Chittagong Ship-breaking Yards, S N Corporation and so on. These players are focusing on annual capacity expansion to increase their market share in global market. For instance, Indian government has planned to double the annual capacity of Alang Ship Breaking Yard in upcoming years.
LIST OF KEY MARKET PLAYERS
- Alang Ship Breaking Yard (India)
- PHP (Bangladesh)
- Chittagong Ship-breaking Yards (Bangladesh)
- S N Corporation (Bangladesh)
- Gadani Ship Breaking Yard (Pakistan)
- Aliağa Ship Breaking Yard (Turkey)
- Changjiang Ship Breaking Yard (China)
- El-Tareq Ship- breaking Yard (Egypt)
- Habib Group (Bangladesh)
- Zhoushan Ship Breaking (China)
KEY INDUSTRY DEVELOPMENTS:
In December 2023, UAE implemented a new regulation for ship breaking industry and mandated the requirement of dry dock for ship scrapping. Regulation envisioned the safety measures at shipyard for ship breaking activities.
In July 2023, Petrobras announced to develop a new ship breaking facility on a floating offshore platform in Brazil. In collaboration with Gerdau S.A. and Ecovix, Petrobras will develop this environmentally sound ship recycling platform.
In July 2023, European Union has increased the approved shipyards for ship recycling to meet the upcoming demand. The revised list includes 38 yards from Europe, 9 ship yards from Turkey, and 1 ship yard from U.S.
In June 2023, H-Line Shipping, a South Korean ship owner, selected S N Corporation from Bangladesh to scrap a ship under green recycling initiative.
SHIP BREAKING MARKET REPORT SCOPE & SEGMENTATION
| Study Period | 2019-2032 |
|---|---|
| Base Year | 2023 |
| Forecast Period | 2024-2032 |
| Historical Period | 2019-2022 |
| Growth Rate | CAGR of 8.4% from 2024 to 2032 |
| Unit | Value (USD Billion) |
| Market Segmentation | By Light Displacement Tonnage (LDT)
|
By Method
| |
By Type of Ship
| |
| By Geography |
|
Frequently Asked Questions
The market is likely to grow at a CAGR of 8.4% over the forecast period (2024-2032).
Below 20,000 LDT is the dominating segment in Global Ship Breaking Market.
The market size of Europe ship breaking stood at USD 1.64 billion in 2023.
Aging of Ship Fleet and Implementation of Safety & Environmental Norms are the Key Factors in Ship Breaking Market Forecast
Some of the top players in the market are Alang Ship Breaking Yard, PHP, Chittagong Ship-breaking Yards, S N Corporation and so on.
1. Introduction
1.1. Research Scope
1.2. Market Segmentation
1.3. Research Methodology
1.4. Definitions and Assumptions
2. Executive Summary
3. Market Dynamics
3.1. Market Drivers
3.2. Market Restraints
3.3. Market Opportunities
3.4. Market Trends
4. Key Insights
4.1. Market Penetration Strategies – Merger & Acquisition, Partnership & Collaboration, R&D Investment and Others
4.2. Regulatory Landscape
4.3. Supply Chain Analysis
4.4. Latest Technological Advancements
4.5. Qualitative Insights – Impact of COVID-19 Pandemic on Global Ship Breaking Market
5. Global Ship Breaking Market Analysis, Insights and Forecast, 2019-2032
5.1 Key Findings / Definition
5.2. Market Analysis, Insights and Forecast – By Light Displacement Tonnage (LDT)
5.2.1. Below 20,000 Tons
5.2.2. 20,000 to 40,000 Tons
5.2.3. Above 40,000 Tons
5.3. Market Analysis, Insights and Forecast – By Method
5.3.1. Alongside
5.3.2. Beaching
5.3.3. Dry Dock
5.3.4. Others
5.4. Market Analysis, Insights and Forecast – By Type of Ship
5.4.1. Tankers
5.4.2. Bulk Carriers
5.4.3. Ferries and Passenger Ships
5.4.4. Container Ship
5.4.5. General Cargo Ship
5.4.6. Others
5.5. Market Analysis, Insights and Forecast – By Region
5.5.1. North America
5.5.2. Europe
5.5.3. Asia Pacific
5.5.4. Middle East and Africa
5.5.5. Latin America
6. North America Ship Breaking Market Analysis, Insights and Forecast, 2019-2032
6.1. Market Analysis, Insights and Forecast – By Light Displacement Tonnage (LDT)
6.1.1. Below 20,000 Tons
6.1.2. 20,000 to 40,000 Tons
6.1.3. Above 40,000 Tons
6.2. Market Analysis, Insights and Forecast – By Method
6.2.1. Alongside
6.2.2. Beaching
6.2.3. Dry Dock
6.2.4. Others
6.3. Market Analysis, Insights and Forecast – By Type of Ship
6.3.1. Tankers
6.3.2. Bulk Carriers
6.3.3. Ferries and Passenger Ships
6.3.4. Container Ship
6.3.5. General Cargo Ship
6.3.6. Others
6.4. Market Analysis, Insights and Forecast – By Country
6.4.1. U.S.
6.4.1.1. Market Analysis, Insights and Forecast – By Light Displacement Tonnage (LDT)
6.4.1.1.1. Below 20,000 Tons
6.4.1.1.2. 20,000 to 40,000 Tons
6.4.1.1.3. Above 40,000 Tons
6.4.2. Canada
6.4.2.1. Market Analysis, Insights and Forecast – By Light Displacement Tonnage (LDT)
6.4.2.1.1. Below 20,000 Tons
6.4.2.1.2. 20,000 to 40,000 Tons
6.4.2.1.3. Above 40,000 Tons
7. Europe Ship Breaking Market Analysis, Insights and Forecast, 2019-2032
7.1. Market Analysis, Insights and Forecast – By Light Displacement Tonnage (LDT)
7.1.1. Below 20,000 Tons
7.1.2. 20,000 to 40,000 Tons
7.1.3. Above 40,000 Tons
7.2. Market Analysis, Insights and Forecast – By Method
7.2.1. Alongside
7.2.2. Beaching
7.2.3. Dry Dock
7.2.4. Others
7.3. Market Analysis, Insights and Forecast – By Type of Ship
7.3.1. Tankers
7.3.2. Bulk Carriers
7.3.3. Ferries and Passenger Ships
7.3.4. Container Ship
7.3.5. General Cargo Ship
7.3.6. Others
7.4. Market Analysis, Insights and Forecast – By Country
7.4.1. U.K.
7.4.1.1. Market Analysis, Insights and Forecast – By Light Displacement Tonnage (LDT)
7.4.1.1.1. Below 20,000 Tons
7.4.1.1.2. 20,000 to 40,000 Tons
7.4.1.1.3. Above 40,000 Tons
7.4.2. Germany
7.4.2.1. Market Analysis, Insights and Forecast – By Light Displacement Tonnage (LDT)
7.4.2.1.1. Below 20,000 Tons
7.4.2.1.2. 20,000 to 40,000 Tons
7.4.2.1.3. Above 40,000 Tons
7.4.3. France
7.4.3.1. Market Analysis, Insights and Forecast – By Light Displacement Tonnage (LDT)
7.4.3.1.1. Below 20,000 Tons
7.4.3.1.2. 20,000 to 40,000 Tons
7.4.3.1.3. Above 40,000 Tons
7.4.4. Russia
7.4.4.1. Market Analysis, Insights and Forecast – By Light Displacement Tonnage (LDT)
7.4.4.1.1. Below 20,000 Tons
7.4.4.1.2. 20,000 to 40,000 Tons
7.4.4.1.3. Above 40,000 Tons
7.4.5. Greece
7.4.5.1. Market Analysis, Insights and Forecast – By Light Displacement Tonnage (LDT)
7.4.5.1.1. Below 20,000 Tons
7.4.5.1.2. 20,000 to 40,000 Tons
7.4.5.1.3. Above 40,000 Tons
7.4.6. Norway
7.4.6.1. Market Analysis, Insights and Forecast – By Light Displacement Tonnage (LDT)
7.4.6.1.1. Below 20,000 Tons
7.4.6.1.2. 20,000 to 40,000 Tons
7.4.6.1.3. Above 40,000 Tons
7.4.7. Netherlands
7.4.7.1. Market Analysis, Insights and Forecast – By Light Displacement Tonnage (LDT)
7.4.7.1.1. Below 20,000 Tons
7.4.7.1.2. 20,000 to 40,000 Tons
7.4.7.1.3. Above 40,000 Tons
7.4.8. Rest of Europe
7.4.8.1. Market Analysis, Insights and Forecast – By Light Displacement Tonnage (LDT)
7.4.8.1.1. Below 20,000 Tons
7.4.8.1.2. 20,000 to 40,000 Tons
7.4.8.1.3. Above 40,000 Tons
8. Asia Pacific Ship Breaking Market Analysis, Insights and Forecast, 2019-2032
8.1. Market Analysis, Insights and Forecast – By Light Displacement Tonnage (LDT)
8.1.1. Below 20,000 Tons
8.1.2. 20,000 to 40,000 Tons
8.1.3. Above 40,000 Tons
8.2. Market Analysis, Insights and Forecast – By Method
8.2.1. Alongside
8.2.2. Beaching
8.2.3. Dry Dock
8.2.4. Others
8.3. Market Analysis, Insights and Forecast – By Type of Ship
8.3.1. Tankers
8.3.2. Bulk Carriers
8.3.3. Ferries and Passenger Ships
8.3.4. Container Ship
8.3.5. General Cargo Ship
8.3.6. Others
8.4. Market Analysis, Insights and Forecast – By Country
8.4.1. China
8.4.1.1. Market Analysis, Insights and Forecast – By Light Displacement Tonnage (LDT)
8.4.1.1.1. Below 20,000 Tons
8.4.1.1.2. 20,000 to 40,000 Tons
8.4.1.1.3. Above 40,000 Tons
8.4.2. Japan
8.4.2.1. Market Analysis, Insights and Forecast – By Light Displacement Tonnage (LDT)
8.4.2.1.1. Below 20,000 Tons
8.4.2.1.2. 20,000 to 40,000 Tons
8.4.2.1.3. Above 40,000 Tons
8.4.3. India
8.4.3.1. Market Analysis, Insights and Forecast – By Light Displacement Tonnage (LDT)
8.4.3.1.1. Below 20,000 Tons
8.4.3.1.2. 20,000 to 40,000 Tons
8.4.3.1.3. Above 40,000 Tons
8.4.4. South Korea
8.4.4.1. Market Analysis, Insights and Forecast – By Light Displacement Tonnage (LDT)
8.4.4.1.1. Below 20,000 Tons
8.4.4.1.2. 20,000 to 40,000 Tons
8.4.4.1.3. Above 40,000 Tons
8.4.5. Taiwan
8.4.5.1. Market Analysis, Insights and Forecast – By Light Displacement Tonnage (LDT)
8.4.5.1.1. Below 20,000 Tons
8.4.5.1.2. 20,000 to 40,000 Tons
8.4.5.1.3. Above 40,000 Tons
8.4.6. Singapore
8.4.6.1. Market Analysis, Insights and Forecast – By Light Displacement Tonnage (LDT)
8.4.6.1.1. Below 20,000 Tons
8.4.6.1.2. 20,000 to 40,000 Tons
8.4.6.1.3. Above 40,000 Tons
8.4.7. Rest of Asia Pacific
8.4.7.1. Market Analysis, Insights and Forecast – By Light Displacement Tonnage (LDT)
8.4.7.1.1. Below 20,000 Tons
8.4.7.1.2. 20,000 to 40,000 Tons
8.4.7.1.3. Above 40,000 Tons
9. Middle East and Africa Ship Breaking Market Analysis, Insights and Forecast, 2019-2032
9.1. Market Analysis, Insights and Forecast – By Light Displacement Tonnage (LDT)
9.1.1. Below 20,000 Tons
9.1.2. 20,000 to 40,000 Tons
9.1.3. Above 40,000 Tons
9.2. Market Analysis, Insights and Forecast – By Method
9.2.1. Alongside
9.2.2. Beaching
9.2.3. Dry Dock
9.2.4. Others
9.3. Market Analysis, Insights and Forecast – By Type of Ship
9.3.1. Tankers
9.3.2. Bulk Carriers
9.3.3. Ferries and Passenger Ships
9.3.4. Container Ship
9.3.5. General Cargo Ship
9.3.6. Others
9.4. Market Analysis, Insights and Forecast – By Country
9.4.1. UAE
9.4.1.1. Market Analysis, Insights and Forecast – By Light Displacement Tonnage (LDT)
9.4.1.1.1. Below 20,000 Tons
9.4.1.1.2. 20,000 to 40,000 Tons
9.4.1.1.3. Above 40,000 Tons
9.4.2. Turkey
9.4.2.1. Market Analysis, Insights and Forecast – By Light Displacement Tonnage (LDT)
9.4.2.1.1. Below 20,000 Tons
9.4.2.1.2. 20,000 to 40,000 Tons
9.4.2.1.3. Above 40,000 Tons
9.4.3. South Africa
9.4.3.1. Market Analysis, Insights and Forecast – By Light Displacement Tonnage (LDT)
9.4.3.1.1. Below 20,000 Tons
9.4.3.1.2. 20,000 to 40,000 Tons
9.4.3.1.3. Above 40,000 Tons
9.4.4. Rest of Middle East and Africa
9.4.4.1. Market Analysis, Insights and Forecast – By Light Displacement Tonnage (LDT)
9.4.4.1.1. Below 20,000 Tons
9.4.4.1.2. 20,000 to 40,000 Tons
9.4.4.1.3. Above 40,000 Tons
10. Latin America Ship Breaking Market Analysis, Insights and Forecast, 2019-2032
10.1. Market Analysis, Insights and Forecast – By Light Displacement Tonnage (LDT)
10.1.1. Below 20,000 Tons
10.1.2. 20,000 to 40,000 Tons
10.1.3. Above 40,000 Tons
10.2. Market Analysis, Insights and Forecast – By Method
10.2.1. Alongside
10.2.2. Beaching
10.2.3. Dry Dock
10.2.4. Others
10.3. Market Analysis, Insights and Forecast – By Type of Ship
10.3.1. Tankers
10.3.2. Bulk Carriers
10.3.3. Ferries and Passenger Ships
10.3.4. Container Ship
10.3.5. General Cargo Ship
10.3.6. Others
10.4. Market Analysis, Insights and Forecast – By Country
10.4.1. Brazil
10.4.1.1. Market Analysis, Insights and Forecast – By Light Displacement Tonnage (LDT)
10.4.1.1.1. Below 20,000 Tons
10.4.1.1.2. 20,000 to 40,000 Tons
10.4.1.1.3. Above 40,000 Tons
10.4.2. Mexico
10.4.2.1. Market Analysis, Insights and Forecast – By Light Displacement Tonnage (LDT)
10.4.2.1.1. Below 20,000 Tons
10.4.2.1.2. 20,000 to 40,000 Tons
10.4.2.1.3. Above 40,000 Tons
10.4.3. Rest of Latin America
10.4.3.1. Market Analysis, Insights and Forecast – By Light Displacement Tonnage (LDT)
10.4.3.1.1. Below 20,000 Tons
10.4.3.1.2. 20,000 to 40,000 Tons
10.4.3.1.3. Above 40,000 Tons
11. Competitive Analysis
11.1. Global Market Rank Analysis (2023)
11.2. Competitive Dashboard
12. Company Profiles (Overview, Products & Services, Financials (Based on Availability), Recent Developments, Strategies, SWOT Analysis)
12.1. Alang Ship Breaking Yard (India)
12.2. PHP (Bangladesh)
12.3. Chittagong Ship-breaking Yards (Bangladesh)
12.4. S N Corporation (Bangladesh)
12.5. Gadani Ship Breaking Yard (Pakistan)
12.6. Aliağa Ship Breaking Yard (Turkey)
12.7. Changjiang Ship Breaking Yard (China)
12.8. El-Tareq Ship- breaking Yard (Egypt)
12.9. Habib Group (Bangladesh)
12.10. Zhoushan Ship Breaking (China)
Table 1: Global Ship Breaking Market, (USD Billion) Forecast, By Light Displacement Tonnage (LDT), 2019-2032
Table 2: Global Ship Breaking Market, (USD Billion) Forecast, By Method, 2019-2032
Table 3: Global Ship Breaking Market, (USD Billion) Forecast, By Type of Ship, 2019-2032
Table 4: Global Ship Breaking Market (USD Billion) Forecast, By Region, 2019-2032
Table 5: North America Ship Breaking Market, (USD Billion) Forecast, By Light Displacement Tonnage (LDT), 2019-2032
Table 6: North America Ship Breaking Market, (USD Billion) Forecast, By Method, 2019-2032
Table 7: North America Ship Breaking Market, (USD Billion) Forecast, By Type of Ship, 2019-2032
Table 8: North America Ship Breaking Market (USD Billion) Forecast, By Country, 2019-2032
Table 9: U.S. Ship Breaking Market, (USD Billion) Forecast, By Light Displacement Tonnage (LDT), 2019-2032
Table 10: Canada Ship Breaking Market, (USD Billion) Forecast, By Light Displacement Tonnage (LDT), 2019-2032
Table 11: Europe Ship Breaking Market, (USD Billion) Forecast, By Light Displacement Tonnage (LDT), 2019-2032
Table 12: Europe Ship Breaking Market, (USD Billion) Forecast, By Method, 2019-2032
Table 13: Europe Ship Breaking Market, (USD Billion) Forecast, By Type of Ship, 2019-2032
Table 14: Europe Ship Breaking Market (USD Billion) Forecast, By Country, 2019-2032
Table 15: U.K. Ship Breaking Market, (USD Billion) Forecast, By Light Displacement Tonnage (LDT), 2019-2032
Table 16: Germany Ship Breaking Market, (USD Billion) Forecast, By Light Displacement Tonnage (LDT), 2019-2032
Table 17: France Ship Breaking Market, (USD Billion) Forecast, By Light Displacement Tonnage (LDT), 2019-2032
Table 18: Russia Ship Breaking Market, (USD Billion) Forecast, By Light Displacement Tonnage (LDT), 2019-2032
Table 19: Greece Ship Breaking Market, (USD Billion) Forecast, By Light Displacement Tonnage (LDT), 2019-2032
Table 20: Norway Ship Breaking Market, (USD Billion) Forecast, By Light Displacement Tonnage (LDT), 2019-2032
Table 21: Netherlands Ship Breaking Market, (USD Billion) Forecast, By Light Displacement Tonnage (LDT), 2019-2032
Table 22: Rest of Europe Ship Breaking Market, (USD Billion) Forecast, By Light Displacement Tonnage (LDT), 2019-2032
Table 23: Asia Pacific Ship Breaking Market, (USD Billion) Forecast, By Light Displacement Tonnage (LDT), 2019-2032
Table 24: Asia Pacific Ship Breaking Market, (USD Billion) Forecast, By Method, 2019-2032
Table 25: Asia Pacific Ship Breaking Market, (USD Billion) Forecast, By Type of Ship, 2019-2032
Table 26: Asia Pacific Ship Breaking Market (USD Billion) Forecast, By Country, 2019-2032
Table 27: China Ship Breaking Market, (USD Billion) Forecast, By Light Displacement Tonnage (LDT), 2019-2032
Table 28: Japan Ship Breaking Market, (USD Billion) Forecast, By Light Displacement Tonnage (LDT), 2019-2032
Table 29: India Ship Breaking Market, (USD Billion) Forecast, By Light Displacement Tonnage (LDT), 2019-2032
Table 30: South Korea Ship Breaking Market, (USD Billion) Forecast, By Light Displacement Tonnage (LDT), 2019-2032
Table 31: Taiwan Ship Breaking Market, (USD Billion) Forecast, By Light Displacement Tonnage (LDT), 2019-2032
Table 32: Singapore Ship Breaking Market, (USD Billion) Forecast, By Light Displacement Tonnage (LDT), 2019-2032
Table 33: Rest of Asia Pacific Ship Breaking Market, (USD Billion) Forecast, By Light Displacement Tonnage (LDT), 2019-2032
Table 34: Middle East and Africa Ship Breaking Market, (USD Billion) Forecast, By Light Displacement Tonnage (LDT), 2019-2032
Table 35: Middle East and Africa Ship Breaking Market, (USD Billion) Forecast, By Method, 2019-2032
Table 36: Middle East and Africa Ship Breaking Market, (USD Billion) Forecast, By Type of Ship, 2019-2032
Table 37: Middle East and Africa Ship Breaking Market (USD Billion) Forecast, By Country, 2019-2032
Table 38: UAE Ship Breaking Market, (USD Billion) Forecast, By Light Displacement Tonnage (LDT), 2019-2032
Table 39: Turkey Ship Breaking Market, (USD Billion) Forecast, By Light Displacement Tonnage (LDT), 2019-2032
Table 40: South Africa Ship Breaking Market, (USD Billion) Forecast, By Light Displacement Tonnage (LDT), 2019-2032
Table 41: Rest of Middle East and Africa Ship Breaking Market, (USD Billion) Forecast, By Light Displacement Tonnage (LDT), 2019-2032
Table 42: Latin America Ship Breaking Market, (USD Billion) Forecast, By Light Displacement Tonnage (LDT), 2019-2032
Table 43: Latin America Ship Breaking Market, (USD Billion) Forecast, By Method, 2019-2032
Table 44: Latin America Ship Breaking Market, (USD Billion) Forecast, By Type of Ship, 2019-2032
Table 45: Latin America Ship Breaking Market (USD Billion) Forecast, By Country, 2019-2032
Table 46: Brazil Ship Breaking Market, (USD Billion) Forecast, By Light Displacement Tonnage (LDT), 2019-2032
Table 47: Mexico Ship Breaking Market, (USD Billion) Forecast, By Light Displacement Tonnage (LDT), 2019-2032
Table 48: Rest of Latin America Ship Breaking Market, (USD Billion) Forecast, By Light Displacement Tonnage (LDT), 2019-2032
Figure 1: Global Ship Breaking Market Revenue Breakdown (USD Billion, %) By Region, 2024 & 2032
Figure 2: Global Ship Breaking Market (%) Breakdown By Light Displacement Tonnage (LDT), 2023 & 2032
Figure 3: Global Ship Breaking Market (USD Billion) Breakdown By Below 20,000 Tons, 2019-2032
Figure 4: Global Ship Breaking Market (USD Billion) Breakdown By 20,000 to 40,000 Tons, 2019-2032
Figure 5: Global Ship Breaking Market (USD Billion) Breakdown By Above 40,000 Tons, 2019-2032
Figure 6: Global Ship Breaking Market (%) Breakdown By Method, 2023 & 2032
Figure 7: Global Ship Breaking Market (USD Billion) Breakdown By Alongside, 2019-2032
Figure 8: Global Ship Breaking Market (USD Billion) Breakdown By Beaching, 2019-2032
Figure 9: Global Ship Breaking Market (USD Billion) Breakdown By Dry Dock, 2019-2032
Figure 10: Global Ship Breaking Market (USD Billion) Breakdown By Others, 2019-2032
Figure 11: Global Ship Breaking Market (%) Breakdown By Type of Ship, 2023 & 2032
Figure 12: Global Ship Breaking Market (USD Billion) Breakdown By Tankers, 2019-2032
Figure 13: Global Ship Breaking Market (USD Billion) Breakdown By Bulk Carriers, 2019-2032
Figure 14: Global Ship Breaking Market (USD Billion) Breakdown By Ferries and Passenger Ships, 2019-2032
Figure 15: Global Ship Breaking Market (USD Billion) Breakdown By Container Ship, 2019-2032
Figure 16: Global Ship Breaking Market (USD Billion) Breakdown By General Cargo Ship, 2019-2032
Figure 17: Global Ship Breaking Market (USD Billion) Breakdown By Others, 2019-2032
Figure 18: Global Ship Breaking Market Share (%) By Region, 2023 & 2032
Figure 19: North America Ship Breaking Market Value (USD Billion) By Light Displacement Tonnage (LDT), 2023 & 2032
Figure 20: North America Ship Breaking Market Value Share (%) By Light Displacement Tonnage (LDT), 2023
Figure 21: North America Ship Breaking Market Value (USD Billion) By Method, 2023 & 2032
Figure 22: North America Ship Breaking Market Value Share (%) By Method, 2023
Figure 23: North America Ship Breaking Market Value (USD Billion) By Type of Ship, 2023 & 2032
Figure 24: North America Ship Breaking Market Value Share (%) By Type of Ship, 2023
Figure 25: North America Ship Breaking Market Value (USD Billion) By Country, 2023 & 2032
Figure 26: North America Ship Breaking Value Share (%) By Country, 2023
Figure 27: U.S. Ship Breaking Market Value (USD Billion) By Light Displacement Tonnage (LDT), 2023 & 2032
Figure 28: U.S. Ship Breaking Market Value Share (%) By Light Displacement Tonnage (LDT), 2023
Figure 29: Canada Ship Breaking Market Value (USD Billion) By Light Displacement Tonnage (LDT), 2023 & 2032
Figure 30: Canada Ship Breaking Market Value Share (%) By Light Displacement Tonnage (LDT), 2023
Figure 31: Europe Ship Breaking Market Value (USD Billion) By Light Displacement Tonnage (LDT), 2023 & 2032
Figure 32: Europe Ship Breaking Market Value Share (%) By Light Displacement Tonnage (LDT), 2023
Figure 33: Europe Ship Breaking Market Value (USD Billion) By Method, 2023 & 2032
Figure 34: Europe Ship Breaking Market Value Share (%) By Method, 2023
Figure 35: Europe Ship Breaking Market Value (USD Billion) By Type of Ship, 2023 & 2032
Figure 36: Europe Ship Breaking Market Value Share (%) By Type of Ship, 2023
Figure 37: Europe Ship Breaking Market Value (USD Billion) By Country, 2023 & 2032
Figure 38: Europe Ship Breaking Value Share (%) By Country, 2023
Figure 39: U.K. Ship Breaking Market Value (USD Billion) By Light Displacement Tonnage (LDT), 2023 & 2032
Figure 40: U.K. Ship Breaking Market Value Share (%) By Light Displacement Tonnage (LDT), 2023
Figure 41: Germany Ship Breaking Market Value (USD Billion) By Light Displacement Tonnage (LDT), 2023 & 2032
Figure 42: Germany Ship Breaking Market Value Share (%) By Light Displacement Tonnage (LDT), 2023
Figure 43: France Ship Breaking Market Value (USD Billion) By Light Displacement Tonnage (LDT), 2023 & 2032
Figure 44: France Ship Breaking Market Value Share (%) By Light Displacement Tonnage (LDT), 2023
Figure 45: Russia Ship Breaking Market Value (USD Billion) By Light Displacement Tonnage (LDT), 2023 & 2032
Figure 46: Russia Ship Breaking Market Value Share (%) By Light Displacement Tonnage (LDT), 2023
Figure 47: Greece Ship Breaking Market Value (USD Billion) By Light Displacement Tonnage (LDT), 2023 & 2032
Figure 48: Greece Ship Breaking Market Value Share (%) By Light Displacement Tonnage (LDT), 2023
Figure 49: Norway Ship Breaking Market Value (USD Billion) By Light Displacement Tonnage (LDT), 2023 & 2032
Figure 50: Norway Ship Breaking Market Value Share (%) By Light Displacement Tonnage (LDT), 2023
Figure 51: Netherlands Ship Breaking Market Value (USD Billion) By Light Displacement Tonnage (LDT), 2023 & 2032
Figure 52: Netherlands Ship Breaking Market Value Share (%) By Light Displacement Tonnage (LDT), 2023
Figure 53: Rest of Europe Ship Breaking Market Value (USD Billion) By Light Displacement Tonnage (LDT), 2023 & 2032
Figure 54: Rest of Europe Ship Breaking Market Value Share (%) By Light Displacement Tonnage (LDT), 2023
Figure 55: Asia Pacific Ship Breaking Market Value (USD Billion) By Light Displacement Tonnage (LDT), 2023 & 2032
Figure 56: Asia Pacific Ship Breaking Market Value Share (%) By Light Displacement Tonnage (LDT), 2023
Figure 57: Asia Pacific Ship Breaking Market Value (USD Billion) By Method, 2023 & 2032
Figure 58: Asia Pacific Ship Breaking Market Value Share (%) By Method, 2023
Figure 59: Asia Pacific Ship Breaking Market Value (USD Billion) By Type of Ship, 2023 & 2032
Figure 60: Asia Pacific Ship Breaking Market Value Share (%) By Type of Ship, 2023
Figure 61: Asia Pacific Ship Breaking Market Value (USD Billion) By Country, 2023 & 2032
Figure 62: Asia Pacific Ship Breaking Value Share (%) By Country, 2023
Figure 63: China Ship Breaking Market Value (USD Billion) By Light Displacement Tonnage (LDT), 2023 & 2032
Figure 64: China Ship Breaking Market Value Share (%) By Light Displacement Tonnage (LDT), 2023
Figure 65: Japan Ship Breaking Market Value (USD Billion) By Light Displacement Tonnage (LDT), 2023 & 2032
Figure 66: Japan Ship Breaking Market Value Share (%) By Light Displacement Tonnage (LDT), 2023
Figure 67: India Ship Breaking Market Value (USD Billion) By Light Displacement Tonnage (LDT), 2023 & 2032
Figure 68: India Ship Breaking Market Value Share (%) By Light Displacement Tonnage (LDT), 2023
Figure 69: South Korea Ship Breaking Market Value (USD Billion) By Light Displacement Tonnage (LDT), 2023 & 2032
Figure 70: South Korea Ship Breaking Market Value Share (%) By Light Displacement Tonnage (LDT), 2023
Figure 71: Taiwan Ship Breaking Market Value (USD Billion) By Light Displacement Tonnage (LDT), 2023 & 2032
Figure 72: Taiwan Ship Breaking Market Value Share (%) By Light Displacement Tonnage (LDT), 2023
Figure 73: Singapore Ship Breaking Market Value (USD Billion) By Light Displacement Tonnage (LDT), 2023 & 2032
Figure 74: Singapore Ship Breaking Market Value Share (%) By Light Displacement Tonnage (LDT), 2023
Figure 75: Rest of Asia Pacific Ship Breaking Market Value (USD Billion) By Light Displacement Tonnage (LDT), 2023 & 2032
Figure 76: Rest of Asia Pacific Ship Breaking Market Value Share (%) By Light Displacement Tonnage (LDT), 2023
Figure 77: Middle East and Africa Ship Breaking Market Value (USD Billion) By Light Displacement Tonnage (LDT), 2023 & 2032
Figure 78: Middle East and Africa Ship Breaking Market Value Share (%) By Light Displacement Tonnage (LDT), 2023
Figure 79: Middle East and Africa Ship Breaking Market Value (USD Billion) By Method, 2023 & 2032
Figure 80: Middle East and Africa Ship Breaking Market Value Share (%) By Method, 2023
Figure 81: Middle East and Africa Ship Breaking Market Value (USD Billion) By Type of Ship, 2023 & 2032
Figure 82: Middle East and Africa Ship Breaking Market Value Share (%) By Type of Ship, 2023
Figure 83: Middle East and Africa Ship Breaking Market Value (USD Billion) By Country, 2023 & 2032
Figure 84: Middle East and Africa Ship Breaking Value Share (%) By Country, 2023
Figure 85: UAE Ship Breaking Market Value (USD Billion) By Light Displacement Tonnage (LDT), 2023 & 2032
Figure 86: UAE Ship Breaking Market Value Share (%) By Light Displacement Tonnage (LDT), 2023
Figure 87: Turkey Ship Breaking Market Value (USD Billion) By Light Displacement Tonnage (LDT), 2023 & 2032
Figure 88: Turkey Ship Breaking Market Value Share (%) By Light Displacement Tonnage (LDT), 2023
Figure 89: South Africa Ship Breaking Market Value (USD Billion) By Light Displacement Tonnage (LDT), 2023 & 2032
Figure 90: South Africa Ship Breaking Market Value Share (%) By Light Displacement Tonnage (LDT), 2023
Figure 91: Rest of Middle East and Africa Ship Breaking Market Value (USD Billion) By Light Displacement Tonnage (LDT), 2023 & 2032
Figure 92: Rest of Middle East and Africa Ship Breaking Market Value Share (%) By Light Displacement Tonnage (LDT), 2023
Figure 93: Latin America Ship Breaking Market Value (USD Billion) By Light Displacement Tonnage (LDT), 2023 & 2032
Figure 94: Latin America Ship Breaking Market Value Share (%) By Light Displacement Tonnage (LDT), 2023
Figure 95: Latin America Ship Breaking Market Value (USD Billion) By Method, 2023 & 2032
Figure 96: Latin America Ship Breaking Market Value Share (%) By Method, 2023
Figure 97: Latin America Ship Breaking Market Value (USD Billion) By Type of Ship, 2023 & 2032
Figure 98: Latin America Ship Breaking Market Value Share (%) By Type of Ship, 2023
Figure 99: Latin America Ship Breaking Market Value (USD Billion) By Country, 2023 & 2032
Figure 100: Latin America Ship Breaking Value Share (%) By Country, 2023
Figure 101: Brazil Ship Breaking Market Value (USD Billion) By Light Displacement Tonnage (LDT), 2023 & 2032
Figure 102: Brazil Ship Breaking Market Value Share (%) By Light Displacement Tonnage (LDT), 2023
Figure 103: Mexico Ship Breaking Market Value (USD Billion) By Light Displacement Tonnage (LDT), 2023 & 2032
Figure 104: Mexico Ship Breaking Market Value Share (%) By Light Displacement Tonnage (LDT), 2023
Figure 105: Rest of Latin America Ship Breaking Market Value (USD Billion) By Light Displacement Tonnage (LDT), 2023 & 2032
Figure 106: Rest of Latin America Ship Breaking Market Value Share (%) By Light Displacement Tonnage (LDT), 2023
Figure 107: Global Ship Breaking Market Rank Analysis, By Key Players, 2023
SHIP BREAKING MARKET REPORT SCOPE & SEGMENTATION
| Study Period | 2019-2032 |
|---|---|
| Base Year | 2023 |
| Forecast Period | 2024-2032 |
| Historical Period | 2019-2022 |
| Growth Rate | CAGR of 8.4% from 2024 to 2032 |
| Unit | Value (USD Billion) |
| Market Segmentation | By Light Displacement Tonnage (LDT)
|
By Method
| |
By Type of Ship
| |
| By Geography |
|